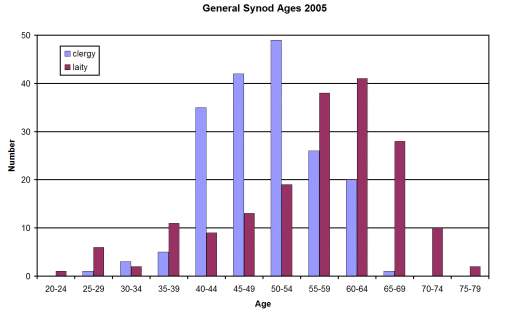
General Synod Statistics 2005
Ages of the elected diocesan representatives of the clergy and laity.
| ages |
clergy
|
laity
|
| mean age |
50
|
56
|
| standard deviation |
7
|
11
|
| oldest |
68
|
78
|
| youngest |
27
|
21
|
For comparison the mean ages in 2000 were 51 (clergy) and 53 (laity).
[Note: The laity figures exclude Bath & Wells (election postponed), Winchester (figures not available) and two members of unknown age.]
The following diagram shows the distribution of ages. [Click on the diagram to see a larger version.]
Percentage of women in elected diocesan representatives
| % of women | 2000 | 2005 |
| clergy | 13 | 24 |
| laity | 45 | 41 |
If the representative archdeacons are included in the clergy figures, then 11% of the diocesan clergy representatives were women in 2000.
Statistics for 2000 are here.
Peter Owen
19 October 2005